

Uptick in Consumer Credit Market Indicator Signals Improving Credit Market Ecosystem
Rising gold prices led to a significant expansion in gold loans, contributing to healthy retail credit growth in the post-festive period
The share of younger borrowers within the first-time borrower segment increased, particularly in consumer durable loans and personal loans
Retail credit growth, boosted by the rationalisation of Goods and Services Tax (GST) rates, stabilised, notably from the second month after the festive period
Mumbai, India, 31 March 2026 – India’s Credit Market Indicator (CMI)1 rose in the December 2025 quarter both year-over-year (YoY) and quarter-over-quarter (QoQ), supported by strong growth in gold loans amid a sharp increase in global gold prices. However, retail credit supply normalised in the post-festive period, easing from the momentum created by the rationalisation of Goods and Services Tax (GST) and returning to end of 2024 levels, indicating a seasonal moderation in short-term demand.
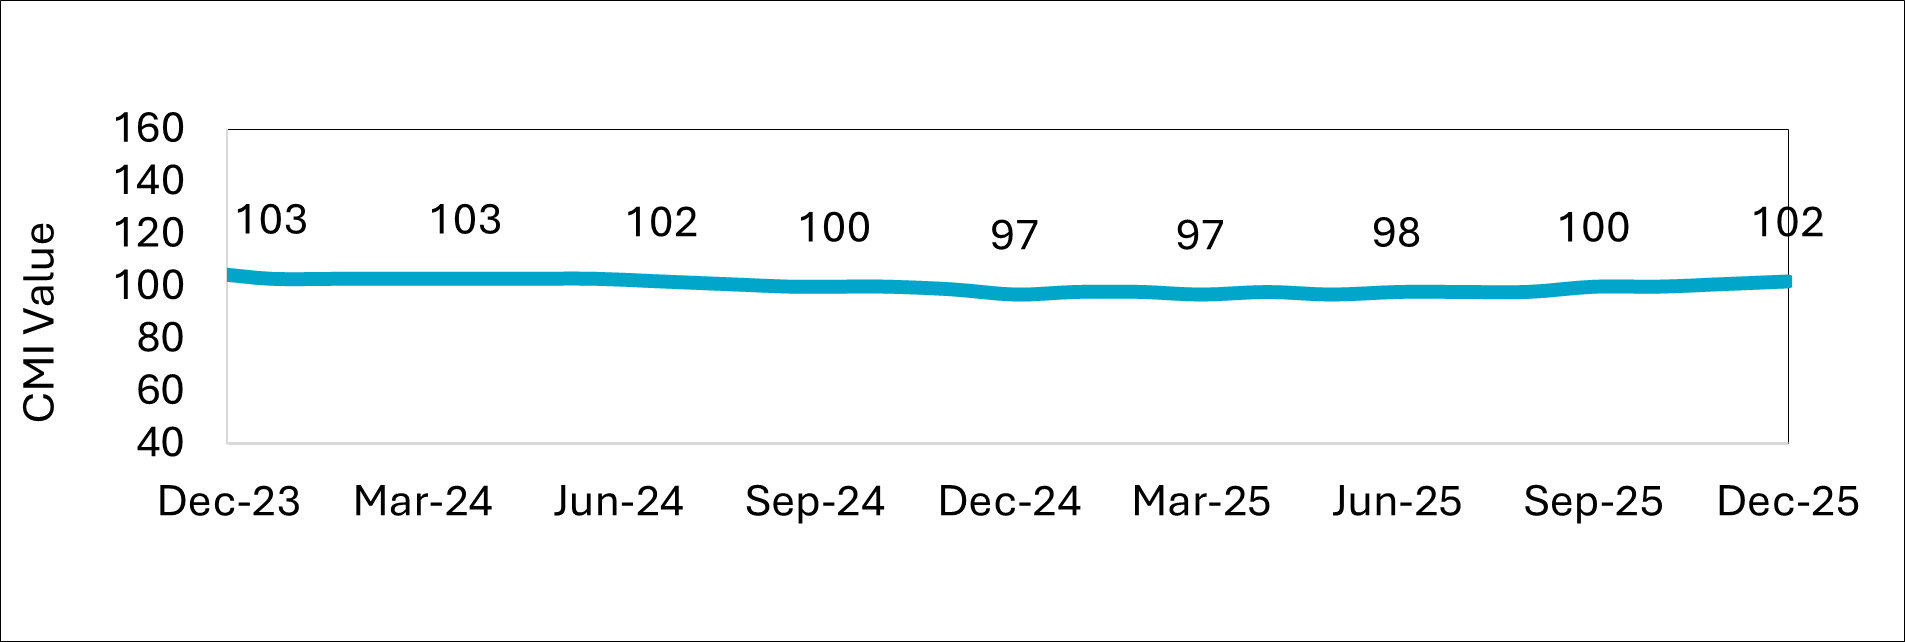
TransUnion CIBIL’s March 2026 Credit Market Report indicates that the Consumer Credit Market Indicator (CMI) increased to 102 for the quarter ended December 2025, up from 97 in the quarter ended December 2024.The December 2025 CMI is also higher by two points from 100 in the preceding quarter of September 2025. The December 2025 quarter CMI marked the third consecutive quarter of improvement.
The CMI is a comprehensive measure of data elements that are summarised monthly to analyse changes in credit market health, categorised under four pillars: demand, supply, consumer behaviour, and performance. These factors are combined into a single, comprehensive CMI indicator, and can also be viewed in more detail individually. A higher CMI reading indicates improving credit market health, whereas a lower reading indicates a decline.
“There is evidence of a shift in retail credit growth dynamics, with momentum extending beyond secured products such as gold loans to rising consumption demand from first-time and younger borrowers. While the post-festive moderation in credit supply reflects seasonal trends, the overall improvement in credit performance reinforces the strength and maturity of India’s credit market,’’ said Mr. Bhavesh Jain, MD and CEO, TransUnion CIBIL.
Chart 1: Credit Market Indicator (CMI) Dec 2023 – Dec 2025
Non-metro Geographies, New-to-Credit2 Consumers Drive Credit Demand
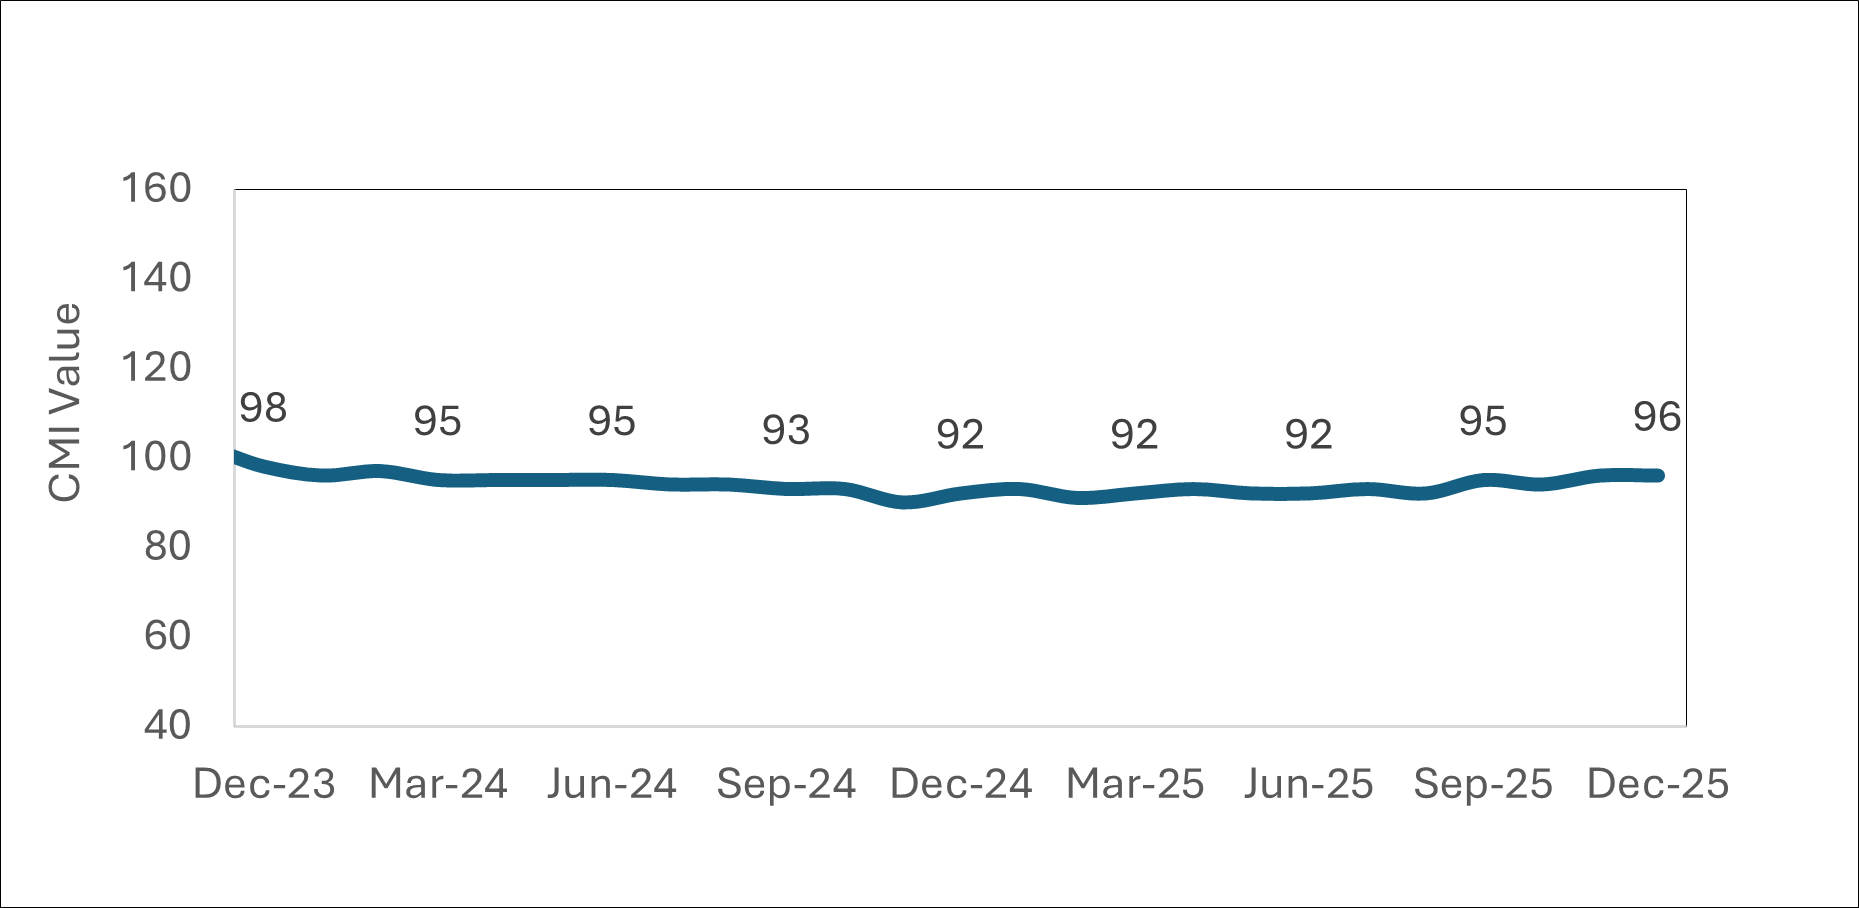
The CMI for demand increased to 96 in the December 2025 quarter from 92 in the December 2024 quarter, buoyed by strong demand from semi-urban and rural consumers. Their share of the total retail borrower base rose to 54%, an increase of three percentage points over the year-ago period. The share of New-to-Credit consumers also increased by one percentage point to 15% of total borrowers.
During the post-festive period, auto loan volumes improved in line with last year’s levels, primarily supported by increased supply in the affordable mid‑segment car category (INR 5–10 lakh). In the post festive period, the average daily supply grew by 10% in auto loans in 2025, compared to 2024.
Chart 2: CMI for Demand Dec 2023 – Dec 2025
“The continued expansion of credit demand in non-metro and semi-urban markets underscores the structural shift underway in India’s lending landscape. As access to formal credit deepens beyond traditional urban centres, we are seeing a more geographically diversified borrower base emerge. This trend reflects improving credit awareness enhanced distribution by lenders and the growing relevance of tailored products for these segments, all of which are contributing to a more inclusive and balanced credit ecosystem,’’ Mr. Jain said.
Credit Supply Increases on the Back of Gold Loans
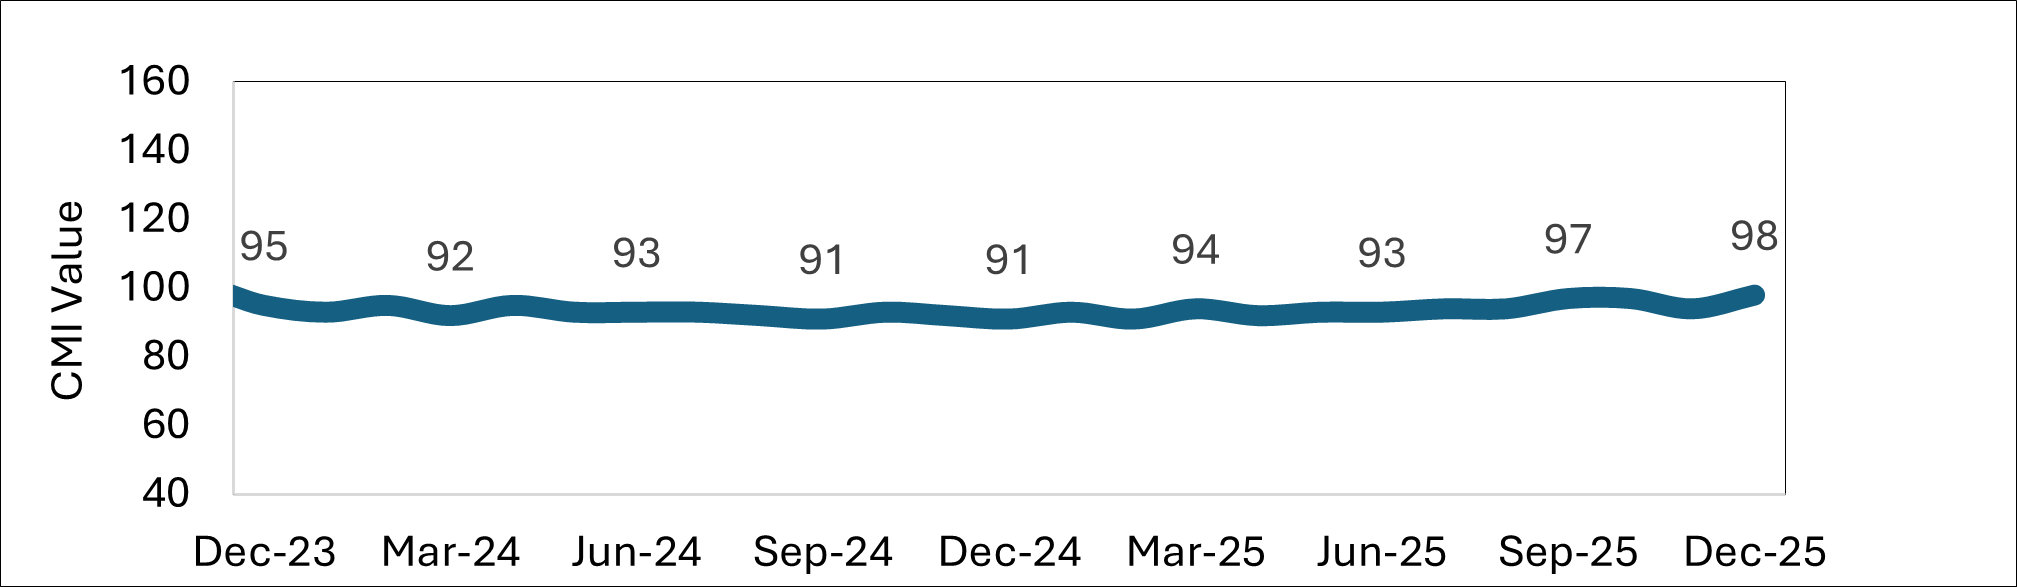
The CMI for supply rose to 98 in the December 2025 quarter from 91 in the December 2024 quarter, largely driven by a significant increase in both the volume and value of gold loans. This growth was supported by higher-ticket gold loans availed by consumers seeking to benefit from rising gold prices.
Since March 2023, the average gold loan ticket size has increased by 1.8X times driving a sharp rise in origination value. The indexed growth (indexed to March 2023) in the gold loan average ticket size touched 189 points in the quarter ended December 2025, compared to 132 in the quarter-ended December 2024. The average ticket size for the three months ended December 2025 stands at INR 1.9 lakh. Gold loans now represent the largest share by volume (36%) and value (39%) among all retail loan categories, accounting for more than one third of the total retail loan supply. In terms of outstanding balances, gold loans are now second only to housing loans.
From a geographic and demographic perspective, gold loans are expanding beyond their traditional concentration in southern states and seeing higher growth in northern and western states. For instance, as of December 2025, the three states with above average YoY growth rates in gold loan origination volumes were Uttar Pradesh – 96%, Madhya Pradesh – 80% and Rajasthan – 79%. Additionally, more than half, 54%, are being utilised by prime and above consumers indicating a more diverse credit profile. This trend also highlights the growing acceptance of gold loans as a mainstream retail credit product.
Chart 3: CMI for Supply Dec 2023 – Dec 2025
Consumption-led Credit Revives First-Time Borrower Segment
The first-time-borrowers (FTB)3 segment grew 7% by originating consumers YoY in the December 2025 quarter, supported by strong momentum in consumption-led credit. Within this segment, personal loans recorded a 20% YoY increase, compared to a 3% decline in the quarter ended December 2024. Similarly, consumer durable loans grew 22% YoY, reversing an 11% decline in the year-ago period.
Additionally, borrowers below 35 years old increased by 17% YoY in the December 2025 quarter, compared to a 3% decrease in the December 2024 quarter. This group now constitutes 58% of the FTB segment, and is a key contributor towards its overall growth.
CMI for Performance Increases by Six Points
Improved balance level 90+ days past due (DPD) delinquencies across key product segments led to the CMI for performance increasing by six points to 107 in December 2025, from 101 in December 2024. The micro-loan against property (LAP) segment was the only category to exhibit some stress, with balance-level 90+ DPD delinquency increasing by 35 basis points YoY to 3.1% in December 2025. Despite this increase, delinquency levels have remained broadly stable and range‑bound since the previous quarter.
“India’s retail credit landscape continues to demonstrate resilience and structural depth, supported by a healthy balance between consumption-led demand and improving credit performance. Higher origination volumes in home, auto, and consumer durable loans point to a steady shift toward asset-backed borrowing. Concurrently, rising average loan sizes and a growing share of prime and above borrowers indicate sustained lender focus towards credit tested profiles. This reflects evolving borrower preferences as well as lenders’ ability to adapt to changing credit requirements.
“At the same time, rising participation from first-time borrowers, younger consumers, and non-metro geographies points to a broader formalisation of credit and increasing financial inclusion. As the ecosystem matures, maintaining a strong focus on credit discipline and risk management will remain critical to ensure sustainable long-term growth,’’ said Mr. Jain.
__________________________________________________________________________________
1. The TransUnion CIBIL Credit Market Indicator (CMI) is an evolving model which is regularly reviewed to ensure the most relevant variables and their relative weighting are selected to best chart the credit health of India’s lending market. When selecting certain variables, year-over-year movements are analysed to remove the effects of seasonality. The CMI is not a stationary index; hence the level in itself is not indicative of credit health. The CMI number needs to be looked at in relation to the previous period(s) and not in isolation. A lower CMI number compared to the prior period represents a decline in relative credit health, while a higher number reflects an improvement.
2. NTC (New-to-Credit) Consumers refers to those consumers who do not have a score as of beginning of the month of the loan origination for a given calendar month. An increase in NTC% indicates higher financial inclusion.
3. FTB (First-time-Borrower) refers to consumers who have taken their first ever retail credit product in that particular month or quarter
__________________________________________________________________________________
Disclaimer: This Information above is based on the TransUnion CIBIL Credit Market Indicator Report of December 2025. TransUnion CIBIL does not guarantee the adequacy or completeness of the information and/or its suitability for any specific purpose. TransUnion CIBIL shall not be responsible for any reliance on the Information. The reader should carry out all the necessary analysis that is prudent in their opinion before making any decisions.
India’s pioneer information and insights company, TransUnion CIBIL, makes trust possible by ensuring each person and business entity is reliably represented in the marketplace. We do this by providing an actionable view of consumers and businesses, stewarded with care.
We have developed technology and innovative solutions across core credit, risk and advanced analytics. As a result, consumers and businesses can transact with confidence and achieve great things. We call this Information for Good® — and it leads to economic opportunity, great experiences, and personal empowerment for millions of people and MSMEs in India.
We serve the financial sector as well as MSMEs and individual consumers. Our customers in India include banks, credit institutions, NBFCs, housing finance companies, microfinance companies, telecom companies and insurance firms.
For more information visit www.transunioncibil.com